
CAMBRIDGE INTERNATIONAL AS LEVEL

AS Information Technology (9626)

Access structured revision notes, topical questions, and video explanations
tailored for Cambridge 9626 paper preparation.

Data, Information, and Quality

Understanding the fundamental distinction between raw data and meaningful information forms the foundation of data processing systems.

Information

Information is data that has been processed, given a specific context, and structured so that it becomes meaningful and useful (e.g., knowing 110053 is a postal code in India).

Direct vs. Indirect Data Sources

  • Direct Data: Collected firsthand for a specific task (Original source data). Methods include Questionnaires, Interviews, Observation, and Data Logging.
  • Indirect Data: Obtained from a third party originally gathered for a different purpose. Examples include the Electoral Register or data brokers tracking social media activity.

Advantages and Disadvantages of Direct vs. Indirect Data

Comparison Factor Direct Data Characteristics Indirect Data Characteristics
Reliability & Bias Known origin; allows targeted representative sampling to minimize sampling bias. Origin may be unknown; risk of sampling only a small section, introducing bias.
Cost & Expenses Often more expensive due to paid personnel, travel, and specialized data-gathering equipment. Generally faster and cheaper as collection costs have already been incurred by others.
Sample Size & Access Sample size can be limited by time, funding, geographical barriers, or participant availability. Tends to offer much larger datasets quickly, increasing result confidence.
Timing & Specificity Tailored strictly to current needs; can gather obscure or out-of-season data directly. Restricted to existing datasets; historical or seasonal records (e.g., weather) available anytime.
Format & Processing Raw responses/transcripts can take considerable time to read, transcribe, and structure. Often already collated, structured, and grouped into meaningful categories.
Commercial Potential Can sometimes be sold to other organizations to help offset original collection costs. Organizations typically look to bypass secondary resellers and go directly to sources.

Factors Affecting Information Quality

Accuracy: Must be free from errors and mistakes originating from poor data collection or transposition errors.
Relevance: Must directly meet the user's needs without unnecessary or extraneous detail.
Age (Timeliness): Must be up to date; old data (e.g., outdated marital status) leads to flawed decisions.
Completeness: Must cover all parts of a problem without critical gaps.

Encryption, Methods, and Protocols

Encryption protects data in transit and storage by converting plaintext into unreadable ciphertext using complex algorithms and cryptographic keys.

Core Encryption Process Diagram
Plaintext
+
Encryption Algorithm & Key
Ciphertext (Scrambled)
Decryption & Key
Plaintext

Interactive Simulation: Caesar Cipher Tool

Test the shift cipher method used historically by Julius Caesar.

Encrypted Result: JGNNQ YQTNF

Asymmetric Encryption

Uses two different keys: a public key to encrypt data and a private key held securely by the recipient to decrypt it. Widely used in secure web browsing and emails.

Key Encryption Protocols

  • SSL / TLS: Secure Sockets Layer / Transport Layer Security secures web traffic (HTTPS), verifies server identity via digital certificates, and ensures data integrity.
  • IPsec: Secures communications across IP networks, frequently utilized in Virtual Private Networks (VPNs).
  • SSH (Secure Shell): Enables secure remote login and command-line execution over a network.

Primary Practical Uses of Encryption

Application Area How It Works Key Benefits & Considerations
Hard-Disk Encryption Specialized software automatically encrypts files when written to disk and decrypts them when read. Covers data files, OS, and software. Protects data if laptops/devices are stolen or left unattended. Consideration: Disk crashes or corruption can make data recovery difficult, and booting may be slower.
Email Encryption Encrypts the connection, outgoing messages, and archived/saved messages typically using asymmetric encryption (public/private keys). Prevents interception and unauthorized reading of confidential emails or login details. Consideration: Requires digital certificate management.
HTTPS Website Encryption Combines asymmetric encryption (to securely share a random session key) and symmetric encryption (for ongoing session traffic). Secures online shopping, banking, and confidential transmissions against eavesdroppers. Indicated by the HTTPS:// prefix and padlock icon.

Advantages and Disadvantages of Encryption Protocols & Methods

Aspect / Category Advantages / Pros Disadvantages / Cons
General Encryption Protects personal and corporate data against identity theft, cyber-fraud, ransom, and corporate espionage. Keeps data secure on stolen/unattended devices. Increases CPU overhead and memory usage, leading to slower load times. Larger keys require more computing power. Private key loss can cause permanent data loss.
SSL/TLS vs. IPsec (VPNs) SSL/TLS: Easier certificate management, lower cost, client certificates are optional, and no client software purchase is typically required. SSL/TLS: Optional user authentication weakens security compared to IPsec; non-web apps need extra software downloads that firewalls might block; not supported on all OS for VPN tunnels.
IPsec (VPNs) IPsec: Stronger security since both client and server authentication are strictly required; supported natively by a wide range of operating systems. IPsec: Much harder and more time-consuming to manage systems; requires buying and configuring separate client software, increasing overall setup costs.

Checking Data Accuracy: Validation & Verification

Validation checks that data is reasonable and sensible, whereas verification checks that data has been copied or entered correctly without errors. Both are essential to ensure data accuracy.

Validation Checks Summary

Presence Check: Ensures mandatory fields are not left blank.
Range Check: Confirms numeric values fall strictly between specified upper and lower limits.
Type (Character) Check: Restricts input to specific data types or valid characters.
Length Check: Ensures entries contain an exact number of characters or fall within a range.
Format (Picture) Check: Matches a specific pattern of characters (e.g., 2 digits + 1 uppercase letter).
Check Digit: Arithmetic calculation appended to codes to catch transposition errors.
Lookup Check: Compares entered data against a predefined list of valid entries.
Consistency Check: Verifies that data across two related fields makes sense together.
Limit Check: Similar to a range check, but applied to only a single boundary.

Verification Methods Summary

  • Visual Checking: Manual side-by-side comparison against source documents.
  • Double Data Entry: Data is entered twice (by one or two operators), and the computer compares both entries for discrepancies.
  • Parity Check: Adds a parity bit to ensure every byte has an even (or odd) number of 1s during data transmission.
  • Checksum / Hash Total / Control Total: Mathematical totals or checksums calculated before and after file transmission to detect corruption.

Interactive Validation & Verification Simulator

Select a check type (Validation or Verification), review its rule, enter a test value, and run the simulator.

Current Rule: Field cannot be left blank.

Data Processing Methods & Comparative Analysis

Data processing converts raw inputs into structured information through three primary methodologies:

  • Batch Processing: Large volumes of transactions collected over time and processed together without human interaction (e.g., payroll, billing run overnight). Uses Master and Transaction files via sequential access.
  • Online Processing: Immediate execution of individual transactions with minimal delay, utilizing direct access (e.g., EFTPOS, ATM transfers, and automated stock control).
  • Real-Time Processing: Continuous closed-loop feedback systems where computer outputs directly affect inputs instantly with zero delay (e.g., missile guidance, central heating thermostats).

Interactive Scenario Matcher

Select a business scenario to determine the optimal processing architecture:

Recommended: Batch Processing. Transactions are collected over time and executed together automatically without requiring user interaction.

Advantages and Disadvantages of Processing Methods

Method Comparison Advantages / Pros Disadvantages / Cons
Real-Time vs. Batch Real-time provides instant responses and up-to-date data for immediate actions. Batch uses CPU efficiently at off-peak hours and lowers hardware/maintenance costs. Real-time occupies the CPU constantly, requires expensive complex systems, and collects data instantly at higher costs. Batch delays updating master files until processing runs.
Real-Time vs. Online Online systems are easier to maintain and upgrade because computers are less busy overnight, allowing scheduled downtime. Real-time systems operate continuously with no quiet periods to safely shut down or perform heavy system updates.
Online vs. Batch Online reveals errors instantly for immediate correction. Batch saves significantly on staff wages since fewer employees can enter all data at once at a convenient time. Online requires heavy investment in extra hardware workstations and keeps staff connected at all times. Batch only reveals errors during processing (often overnight).

Contextual Suitability & Mixed Processing Systems

Mixed Processing Architecture: Because each processing mode has specific strengths and weaknesses, most modern business systems use a mixture of batch and online processing to overcome individual limitations and maximize overall operational efficiency[cite: 2].

Lesson Summary

This chapter covered the essential lifecycle of data management:

  • Data vs. Information: Data is raw and meaningless until processed into contextualized information.
  • Quality Factors: High-quality information requires accuracy, relevance, appropriate age, correct detail level, and completeness.
  • Security: Encryption (symmetric and asymmetric) and protocols (SSL/TLS) protect sensitive communications against interception.
  • Data Integrity: Validation rules ensure data reasonableness, while verification methods guarantee error-free data entry and transfer.
  • Processing Modes: Batch, online, and real-time architectures serve distinct operational needs ranging from automated payrolls to continuous feedback systems, frequently combined in modern businesses.

Mainframes and Supercomputers

Mainframe Computers

Mainframes are large, highly powerful, multi-user, multitasking computers designed primarily for bulk data processing applications by large organizations (e.g., banking transactions, censuses, and insurance statistics) .

  • RAS Characteristics: Designed with extreme Reliability, Availability, and Serviceability. They feature hot-swappable components and can run continuously for years without downtime .
  • Performance Metrics: Measured in **MIPS** (Millions of Instructions Per Second) .
  • Hardware Architecture: Utilizes parallel processing, specialized peripheral processors (System Assist Processors - SAPs) for I/O operations, and robust multi-layer security .

Supercomputers

Supercomputers are specialized systems engineered to execute massive quantities of complex calculations as quickly as possible, utilizing up to hundreds of thousands of processor cores .

  • Key Uses: Quantum mechanics, climate research, weather forecasting, and genetic analysis .
  • Performance Metrics: Measured in **FLOPS** (Floating Point Operations Per Second) or Petaflops .
  • Cooling & Environment: Due to immense heat generation drawing megawatts of power, they require advanced direct liquid-cooling solutions .
Feature Mainframe Computers Supercomputers
Primary Focus High throughput, multi-user transaction processing . Maximum speed for complex mathematical calculations .
Lifespan Long longevity (often 10+ years). Shorter lifespan (~5 years) due to rapid advancements .
Operating Systems Multiple OS simultaneously (e.g., z/OS, z/VM, Linux) . Typically unified Linux distributions (Open Source) .

System Software, Operating Systems, Drivers & Translators

2.2.6 Operating Systems (OS) & Booting

An operating system is critical system software that manages hardware and software resources, serving as an interface between users/applications and computer hardware .

  • Booting Process: When switching on, the computer loads the BIOS (Basic Input/Output System) stored in ROM. The BIOS checks devices and loads the OS from backing storage (hard disk/SSD) into RAM .
  • Memory Management: Allocates specific RAM partitions to running programs. Prevents programs from overlapping into each other's memory allocation, which avoids data corruption and system crashes .
  • Input/Output & Storage Management: Handles communication with input/output devices via device drivers and maintains a record of file names, positions, and empty spaces on backing storage .
  • Multitasking & Fairness: Loads software into RAM and allocates a tiny, fair slice of processor time to each active task or program cyclically .
  • Error Handling: Displays intervention messages when invalid inputs occur (e.g., typing invalid characters like / in a file name) .
  • Security & Access Control: Encrypts stored passwords and matches hash calculations upon login. Enforces file permissions and access rights so unauthorized users cannot access sensitive files .
  • Safe Shutdown: Safely closes running tasks, unloads memory bit-by-bit, and signals power management hardware to cut power .

2.2.5 Device Drivers

A device driver is a small program allowing the OS and applications to communicate with peripheral hardware (printers, sound cards, mice, SSDs) . Just like a translator bridging a Spanish and French speaker, drivers translate generic software commands into hardware-specific languages . Without proper drivers installed, special keys or extra features on hardware will fail to function .

2.2.4 Linkers (Link Editors)

A linker combines separate modular object code files (created via a compiler) into a single executable file . Modular programming saves development time and RAM during compilation, though it requires careful management of variable names and detailed documentation .

2.2.3 Compilers vs. Interpreters & Detailed Comparison

High-level languages must be translated into machine code. Below is the detailed breakdown comparing compilers and interpreters:

Feature / Aspect Interpreters (Advantages & Disadvantages) Compilers
Error Correction & Debugging Advantage: Errors are reported instantly line-by-line, allowing real-time debugging and testing of small code snippets without waiting for a full compilation batch . All errors are listed together at the end of compilation, making them harder to locate and fix immediately .
Execution Speed Disadvantage: Slower execution because every statement must be translated repeatedly every time the program runs . Executes quickly all-in-one-go since translation happens only once prior to execution .
Platform Compatibility Advantage: Source code remains intact, allowing execution on any system equipped with the appropriate interpreter . Compiled executables are strictly platform-dependent, running only on the specific OS they were compiled for .
Memory & Intellectual Property Disadvantage: Source code must always be exposed/available, putting intellectual property/copyright at risk. However, it uses less RAM during translation since only a few lines reside in memory . Machine code is hard to understand/alter (protects IP), but compilation demands more memory because the whole program must be loaded at once .

Utility Software, Hard Disks, File Management & Anti-Virus

3.1 Hard Disk Architecture & Formatting Utilities

Hard-disk drives consist of multiple platters, tracks, sectors, cylinders, and data blocks managed by utility software.

Concept / Utility Description & Mechanism
Disk Structure Composed of stacked platters (each surface having a read-write head that floats on air without touching). Surfaces are divided into concentric tracks, sub-divided into sectors. Aligned tracks across platters form a cylinder, and OS handles data in blocks (one or more sectors).
Low-Level Formatting Performed by the manufacturer to establish physical tracks and sectors. Highly risky if attempted by users (renders data unrecoverable and shortens media life).
High-Level Formatting Clears pointers in the File Allocation Table (FAT) rather than erasing actual files permanently. Used to prepare a drive for a new OS and can remove viruses.

3.2 Core File Management & Maintenance Utilities

Utility Program Function & Operational Details
Disk Defragmentation Reorganizes scattered file blocks into contiguous sectors. Reduces read-write head travel time, increasing access speed and system performance.
File Copying (CLI vs. GUI) Creates duplicate files. CLI uses text commands (e.g., 'copy' destination path); GUI utilizes desktop windows, mouse right-clicks, and drag-and-drop drop-down menus.
Deleting & Recovery Deletes pointers in the FAT table, marking sectors as free. Files can be sent to a Recycle Bin/Trash or recovered via data recovery software unless overwritten by new data.
Data Compression (Lossless vs Lossy) Modifies data to occupy less space (speeds up network transfers/streaming). Lossless replaces repeated bit sequences for exact recovery (spreadsheets/databases). Lossy permanently discards unnecessary details (e.g., background video frames, JPEG images, sound).
Back-up Utilities Creates exact file copies to guard against corruption/loss. Includes Full, Incremental (backs up only newly added/changed data), and Differential backups. Features verification (checksums), encryption, and secure offsite/cloud/tape storage.

3.3 Anti-Virus & Malware Detection Methods

Anti-virus software detects and removes malware (viruses, worms, Trojans, adware) using various specialized techniques:

Detection Method How It Works Drawbacks / Risks
Signature-Based Detection Compares file contents against a database of known virus byte sequences (signatures). Quarantines or deletes matching files. Only detects known threats; completely ineffective against brand-new zero-day viruses.
Heuristic-Based Detection (Static) Decompiles programs and compares source code structure against known virus patterns based on percentage matching. Can trigger false positives if general algorithms flag safe files containing minor byte matches.
Behavioural-Based Detection (Dynamic) Monitors runtime behavior for suspicious activity (e.g., mass emailing, modifying critical system files). Can execute code safely inside a virtual sandbox environment where it can do no real harm. Can also generate false positives and requires runtime observation.

Interactive Simulation: Hard Disk Defragmentation

Watch the defragmentation utility reorganize fragmented files into contiguous blocks for maximum performance!

Status: Fragmented Disk (Files A, B, and C are scattered)
A1
B1
Free
A2
C1
B2
Free
C2

Software Choices & User Interfaces

Custom-Written vs. Off-the-Shelf Software

  • Custom-Written: Built specifically for a client's unique requirements. Highly tailored and owned by the client, but significantly more expensive and time-consuming to develop .
  • Off-the-Shelf: Pre-existing software mass-produced for a large market. Cheaper and immediately available, but may contain unused bloatware or lack specific targeted features .

User Interface Types (WIMP & Beyond)

  • CLI (Command Line Interface): Text-based prompts; powerful for technical administrators, but hard to learn and prone to typing errors .
  • GUI (Graphical User Interface): Uses Windows, Icons, Menus, and Pointers (WIMP). Highly intuitive and user-friendly .
  • Dialogue & Gesture Interfaces: Voice recognition and body/face motion tracking; ideal for hands-free environments or accessibility needs .

Lesson Summary Checklist

You have successfully covered the core concepts of Chapter 2 :

  • Characteristics, differences, and performance metrics (MIPS vs. FLOPS) of mainframes and supercomputers .
  • System software components including operating systems, device drivers, compilers, interpreters, and linkers .
  • The purpose and operational mechanics of utility software (disk structure, defragmentation, anti-virus, backup) .
  • Evaluating custom-written versus off-the-shelf software solutions .
  • Analyzing the characteristics, pros, and cons of CLI, GUI, dialogue, and gesture-based user interfaces .

Chapter 3: Monitoring and Control Systems

Interactive Learning Module | AS & A Level Information Technology

Introduction to Monitoring & Control

Everyday systems like refrigerators, weather stations, and automated factories rely on data acquisition and automated response mechanisms .

Monitoring Systems

Observe, measure, and record physical variables over time (e.g., weather data, pollution tracking). They process data so humans can analyze trends. Outputs do not affect inputs .

Control Systems

Manage or regulate processes by changing physical aspects based on collected data. They use real-time processing where outputs directly affect inputs (e.g., turning on a heater changes the temperature) .

Common Sensors & Their Uses

Sensor Type Mechanism / Principle Typical Application
Light / UV Generates electrical energy proportional to light intensity . Weather stations (sunshine hours), UV risk monitoring .
Temperature Changes electrical resistance or generates voltage with heat shifts . Greenhouses, central heating, rivers .
Pressure Converts applied force on a surface into electrical signals . Atmospheric weather tracking .
Humidity / Moisture Combines temperature/moisture checks or light transmission through air/soil . Soil quality management, weather forecasting .
Sound convert sound waves into voltages or electrical signals which are converted by the computer into values to represent sound. environmental monitoring systems to measure noise pollution.
Infrared All bodies possess thermal energy and therefore emit infrared radiation. This radiation is converted into electrical signals as a result. used in environmental monitoring, for example the Earth’s surface temperature can be monitored by satellites.
Reed Switch Not a sensor. used to help measure rainfall
pH / Turbidity Measures hydrogen ion concentration or light reflection from suspended particles . Water pollution monitoring, textile factory runoffs .

Sensor Calibration: Two-Point & Multipoint

Over time, sensors suffer from wear and tear, causing drift. Calibration is the process of testing and modifying a device against a standard reference to ensure accuracy.

Figure 3.1: Two-Point Calibration

Used when both offset and slope errors exist. It measures the sensor against a standard at two extreme points to scale output linearly.

Figure 3.2: Multipoint Calibration

Required when the relationship is nonlinear. It uses curve fitting with a quadratic function $y = ax^2 + bx + c$, requiring at least three test points.

Interactive Simulation: Calibration Curve Analysis

Switch between calibration modes to analyze linear errors versus nonlinear curve-fitting errors.

Standard (Target) Sensor (Actual)

Status: Two-Point Uncalibrated (Linear Offset/Slope Error)

Architecture of Monitoring Systems

Monitoring setups operate continuously. Because most physical sensors output analogue data, an Analogue-to-Digital Converter (ADC) is required before a computer or microprocessor can process or log the data.

Physical Environment
Analogue Sensor
ADC (Conversion)
Microprocessor / Storage
Graph / Log Output

Advantages and Disadvantages of Computer Monitoring (Table 3.2)

Although computers automate monitoring workflows efficiently, human involvement remains essential for setup and programming. Below is the summary comparison:

Advantages of Computer Monitoring

  • High Frequency & Multi-variable: Can take frequent readings and process multiple variables simultaneously.
  • 24/7 Sustained Operation: Can run continuously day and night without fatigue.
  • Automated Outputs: Instantly produces graphs and log results without manual delay.
  • Higher Accuracy: Free from human error during data capture.

Disadvantages of Computer Monitoring

  • High Costs: Expensive to purchase, setup, and maintain.
  • Programming Complexity: Difficult to program computers to interpret complex results.
  • Hardware Wear: Sensors can deteriorate over time.

Control Systems, Microprocessors & Actuators

Control loops combine Sensors (input), Microprocessors (decision making logic), and Actuators (motors, valves, or switches providing physical output like the linear solenoid actuator).

Advantages and Disadvantages of Using Control Technology

Computer-controlled systems bring substantial efficiency, safety, and speed benefits, but they also introduce socioeconomic drawbacks, high costs, and system vulnerabilities. The summary table below categorizes these key impacts:

Category / Application Area Advantages Disadvantages
Greenhouses & Automated Agriculture • Operates continuously (at night, weekends, or holidays) .
• Freedom for humans from routine chores .
• Monitors multiple variables simultaneously with high frequency and reliability .
• Rapid response to issues (e.g., dry soil corrected immediately) .
• Over-reliance can lead to laziness and loss of manual household skills .
• High initial purchase and setup costs for smart devices .
Employment & Labor Market • Creates specialized jobs for IT technicians and software programmers . • Replaces human workers (e.g., parking attendants), resulting in net job losses .
Home Automation & Smart Homes • Greater sense of security (e.g., burglar alarms) .
• Energy savings through automated, efficient heating and power use .
• Assists people with disabilities in navigating and operating home appliances .
• Decreased physical exercise and movement .
• Smart devices are significantly more expensive than standard alternatives .
Transport & Infrastructure • Reduces traffic congestion and eliminates manual delays (smart motorways, automated traffic lights) .
• Creates comfortable indoor/shopping environments via automated climate control .
• Increased operational energy costs for businesses (e.g., air conditioning), leading to higher prices for consumers .
Processing Speed & Reliability • Extremely fast data processing allowing immediate reactions to environmental changes . • Total system failure if there is a computer crash or power outage without backup power supplies .

Specialized Sensors & Comprehensive Simulations

Select a sensor type below to interact with its live simulation model and observe how microprocessors evaluate inputs and drive respective actuators.

Simulation 1: Electromagnetic Field Sensor (Car Park Barrier)

Measures changes in the Earth's magnetic field caused by ferromagnetic metal objects (vehicles) over an induction loop.

Inductor State No Change
ADC & Microprocessor Idle
Barrier Actuator Motor LOWERED (Closed)

Chapter 4: Algorithms and Flowcharts

Master the foundations of computer science logic, pseudocode, flowcharts, and control structures.

Introduction to Algorithms

An algorithm is a set of precise instructions sequenced to solve a problem or represent a calculation. Every computer program is built upon a series of algorithms processed sequentially.

Key Characteristics

  • Linear Progression: Statements executed step-by-step downwards.
  • Variables: Named memory spaces to store data items.
  • Assignment (--->): Storing values or calculation results into variables.

Pseudocode vs Flowcharts

  • Pseudocode: Structured, language-independent text using keywords like INPUT, PRINT, and OUTPUT.
  • Flowcharts: Diagrammatic representations utilizing standard symbols connected by directional flow lines.

Selection & Iteration

Algorithms rely on decision-making and repetition to handle diverse problem scenarios.

Conditional Branching (Selection)

Allows paths of execution to change based on evaluated conditions:

  • IF...THEN...ELSE: Evaluates true/false branches.
  • CASE...ENDCASE: Multi-branch selection based on discrete variable values.

Example: Nested IF Statements (Grade Evaluator)

INPUT mark
    IF mark < 75
        THEN
            IF mark < 60
                THEN
                    IF mark < 40
                        THEN
                            PRINT "Sorry you have failed"
                        ELSE
                            PRINT "You have passed"
                    ENDIF
                ELSE
                    PRINT "Well done. You have been awarded a merit"
            ENDIF
        ELSE
            PRINT "Congratulations you have been awarded a distinction"
    ENDIF

Example: CASE...ENDCASE Statement (Grade Ranges)

INPUT grade
CASE grade OF
    'distinction':    X <- 75
                      Y <- 100
    'merit':          X <- 60
                      Y <- 74
    'pass':           X <- 40
                      Y <- 59
    'fail':           X <- 0
                      Y <- 39
ENDCASE
PRINT "Your mark must have been between ", X, " and ", Y
Loops (Iteration)

Repeats a sequence of statements using conditional or count-controlled checks:

  • Count-Controlled (FOR): Runs a fixed number of times using a counter.
  • Pre-condition (WHILE): Evaluates condition before executing loop body.
  • Post-condition (REPEAT...UNTIL): Executes at least once before checking condition at the end.

Example: WHILE...ENDWHILE Algorithm Using a Counter

count <- 0
INPUT number
WHILE count < number
    count <- count + 1
    PRINT count, "x 10 = ", count*10
ENDWHILE

Example: REPEAT...UNTIL Algorithm Using a Counter

count <- 0
INPUT number
REPEAT
    count <- count + 1
    PRINT count, "x 10 = ", count*10
UNTIL count = number

Example: Nested WHILE...ENDWHILE Loops (Multiplication Tables)

count1 <- 0
INPUT number1   // number of multiplication tables printed out
INPUT number2   // number we want to go up to in each table

WHILE count1 < number2
    count1 <- count1 + 1   // incremented to avoid 0 x 0

    count2 <- 0
    WHILE count2 < number1
        count2 <- count2 + 1 // incremented to avoid 1 x 0
        PRINT count1, "x ", count2, "= ", count1*count2
    ENDWHILE
ENDWHILE

Example: Nested REPEAT...UNTIL Loops (Multiplication Tables)

count1 <- 0
INPUT number1
INPUT number2
REPEAT
    count1 <- count1 + 1
    count2 <- 0
    REPEAT
        count2 <- count2 + 1
        PRINT count1, "x ", count2, "= ", count1*count2
    UNTIL count2 = number1
UNTIL count1 = number2

Interactive Simulation: Maze Navigation (Worked Example 4.01)

Test the sequence-based algorithm to navigate from Start to Finish. Use commands: FD (Forward), RT (Right 90°), LT (Left 90°).

Click 'Run Standard Algorithm' to trace steps: FD4, LT90, FD2, RT90, FD3, LT90, FD5, LT90, FD7.

Subroutines, Parameters & Flowchart Symbols

Complex programs use modular subroutines (procedures and functions) to perform specific sub-tasks.

Flowchart Symbol Reference

Standard symbols used in flowcharts to represent operations, inputs, outputs, and control flows:

Symbol Name Shape / Visual Description & Equivalent Statement
Input/output
This shape symbol represents input or output. It is equivalent to either the INPUT or PRINT statement.
Decision
This is a decision box and is equivalent to the IF statement but is also used in loops.
Terminator (Start/Stop)
This is the symbol used to show where the flowchart begins and also where it ends. It is also used at the start and end of a subroutine.
Process box
This symbol represents any calculation or assigning of variables, usually contains the <- symbol.
Subroutine
This is the symbol used to call a subroutine from the main flowchart. It is equivalent to CALL.
Flow line
This is the symbol that shows which direction you should follow when working through the flowchart.
Connector
A
Sometimes a flowchart can extend over many pages. This symbol indicates the continuation of the flowchart.

Parameters & Scope

Data passed into subroutines are known as parameters. Procedures execute tasks without returning values, whereas functions return computed results.

Subroutine Examples: Geometric Calculations

Modular subroutines like procedures can be defined with parameters and called multiple times within a main program loop:

Procedure: Triangle Area

PROCEDURE triangle(width, height)
    area <- width*height*0.5
    PRINT area
ENDPROCEDURE

Procedure: Rectangle Area

PROCEDURE rectangle(length, width)
    area <- length*width
    PRINT area
ENDPROCEDURE

Main Algorithm Calling Procedures

INPUT width, height               // type in the height and width of the triangle
CALL triangle (width, height)     // this would print out the area
INPUT number                      // type in the number of walls
count <- 0
WHILE count < number
    INPUT length, height
    count <- count + 1
    CALL rectangle (length, height) // this would print out the area of each wall
ENDWHILE

File Handling: Master and Transaction File Updating

Sequential file management involves reading data records from an old master file and a transaction file, evaluating IDs, and writing updates to a new master file:

Algorithm: Master File Update Process

READ first record from the transaction file
READ first record from the old master file
REPEAT
    IF ID of old master file record <> ID of transaction file record
    THEN
        WRITE old master file record to new master file
    ELSE
        IF transaction = C
        THEN
            WRITE data in transaction file record to new master file
        ENDIF
        READ next record from transaction file
    ENDIF
    READ next record from master file
UNTIL end of old master file
WRITE data in transaction file record to new master file
WRITE any remaining transaction file records to the master file

Worked Example 4.16: Flowchart - Totalling Results

A program needs to input the results for 100 students. Each student has 10 different results and the total needs to be output for each student. Create a flowchart for the algorithm.

Step-by-Step Breakdown

  • Step 1: Loop through all 100 students.
    Count-controlled loop
  • Step 2: Loop through all 10 results for each student.
    Count-controlled loop
  • Step 3: Ask for the student's result.
    Output
  • Step 4: Input the student's result.
    Input & store result
  • Step 5: Add the result to their total.
    Process: total = total + studentResult
  • Step 6: Output total at end of student's results.
    Output

Figure 4.52: Flowchart - Totalling results
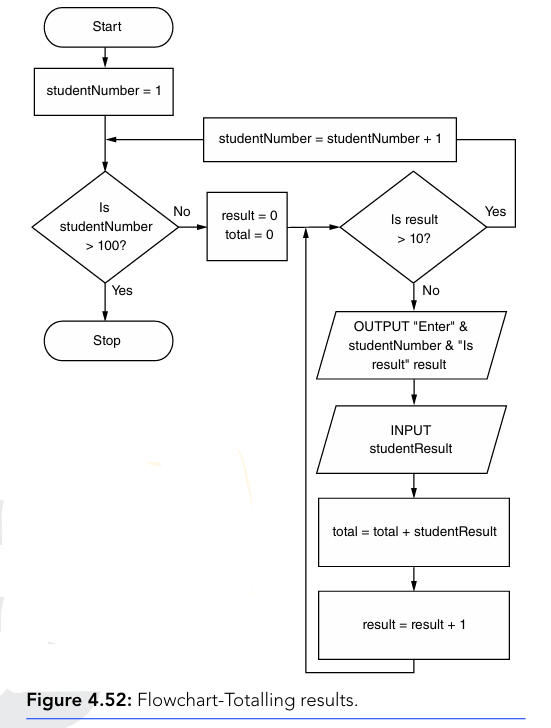
Figure 4.52 Flowchart - Totalling results

Chapter Summary

  • Core Definition: Algorithms are ordered sequences of instructions designed to solve computational problems.
  • Representation: Can be designed using natural language, structured pseudocode, or diagrammatic flowcharts.
  • Control Structures: Rely on linear progression, selection statements (IF/CASE), and iteration loops (FOR/WHILE/REPEAT).
  • Modular Design: Subroutines, procedures, and parameters enable code reuse and structural efficiency.

Chapter 5: eSecurity Interactive Masterclass

Learn how to protect personal data, recognize social engineering attacks, defend against malware, and secure systems.

Understanding Personal Data & Confidentiality

Personal data is any information relating to an identified or identifiable living individual. This includes names, home addresses, email addresses, ID numbers, location data, IP addresses, and cookie IDs.

Data Handling Strategies

  • De-identification: Removing direct identifiers like names, though records can sometimes be re-identified.
  • Pseudonymisation: Replacing personal items with temporary IDs or codes.
  • Anonymisation: Irreversibly altering data so recognition of the individual is impossible.

The GDPR Framework

The General Data Protection Regulation (GDPR) sets strict rules governing data protection, promoting pseudonymisation and anonymisation to safeguard user privacy. Breaching data confidentiality can lead to identity theft, financial fraud, and unauthorized account access.

Keeping Personal Data Secure (Precautions)

  • Firewalls: Hardware or software systems that examine incoming data packets, check IP addresses, and block unauthorized network traffic .
  • Access Levels: Restricting data visibility and user permissions based on user IDs, roles, or smart card authentication .
  • Network Policies: Acceptable use policies that dictate legal and ethical network behavior to reduce internal vulnerabilities .
  • Software Updates: Promptly installing patches and updates to eliminate specific security weaknesses before hackers exploit them .
  • Encryption & Remote Wiping: Ensuring data is unreadable if illegally accessed, and utilizing remote deletion commands to wipe personal data from lost or stolen mobile devices connected to the internet .

Social Engineering & Cyber Attacks

Unauthorised persons use various psychological and technical tricks to harvest personal data without needing to crack deep cryptographic keys.

Phishing

Fraudulent emails masquerading as official entities (e.g., banks or tech companies) containing links to spoofed websites designed to capture credentials.

Smishing & Vishing

Smishing uses SMS text messages with malicious links, while Vishing (voice phishing) uses phone calls or automated systems to trick users into revealing PINs or passwords.

Pharming

Malicious code modifies a computer's local hosts file or corrupts a DNS server, automatically redirecting victims typing legitimate URLs to fake replica websites.

Malicious Software (Malware)

Software designed to disrupt, damage, or gain unauthorized access to computer systems.

Replicating Threats

  • Virus: Attaches to clean files and replicates when executed.
  • Worm: Standalone programs exploiting network vulnerabilities to spread and consume bandwidth/storage.

Deception & Espionage

  • Trojan Horse: Disguised as legitimate software to open backdoors.
  • Spyware / Keylogger: Monitors user actions and records keystrokes secretly.
  • Rootkit: Conceals deep within the OS to grant remote administrator control.

Extortion & Control

  • Ransomware: Encrypts user files and demands payment (usually Bitcoin) for decryption keys.
  • Botnets: Automated networks of infected machines used for spam or DDoS attacks.

Adware (Advertising-Supported Software)

Software engineered to generate income for its creator by automatically displaying unrequested advertisements. Typically downloaded secretly alongside free software, adware tracks user site visits to tailor popup ads to user preferences. While traditionally viewed more as a nuisance than a critical danger, modern adware is increasingly linked to spyware and can degrade system performance while generating a high volume of popups.

Security Controls & Prevention Measures

Robust defense requires a multi-layered approach combining software tools, hardware filters, and administrative policies.

Technical Defenses

  • Firewalls: Inspect incoming and outgoing IP data packets against security rules.
  • Anti-Virus / Anti-Malware: Scans files against signature databases and quarantines threats.
  • Authentication: Multi-factor authentication (MFA), smart cards, and biometrics.

Administrative Controls

  • Software Updates: Patch vulnerabilities immediately upon release.
  • Access Levels: Restrict user privileges based on operational requirements.
  • Penetration Testing: Authorized simulated attacks to uncover system weaknesses.

Lesson Summary

  • Personal Data & GDPR: Personal data identifies individuals directly or indirectly. Frameworks like GDPR enforce privacy via pseudonymisation and anonymisation.
  • Social Engineering: Techniques like phishing, smishing, vishing, and pharming trick users into handing over confidential credentials.
  • Malware Diversity: Threats range from targeted adware and browser popups to destructive ransomware, viruses, worms, and hidden rootkits.
  • Defense in Depth: Security is achieved using firewalls, multi-factor authentication, regular updates, least privilege policies, and employee awareness.

Chapter: The Digital Divide

Explore the gaps in access, causes, affected demographics, broader societal effects, and mitigation strategies.

What is the Digital Divide?

The term digital divide relates to the gap between those people who are able to access modern technology and information and those with restricted or no access . Originally referring strictly to computers, it now encompasses telecommunications, broadband, mobile devices, and digital literacy .

Core Definitions

  • Demographic: A particular section of a population .
  • Economic: Considering a country in terms of its production and consumption of goods and services .
  • Infrastructure: Facilities needed for societal operation, including electrical cables, fibre optics, and mobile masts .

Basic Digital Skills Framework

The Tech Partnership Basic Digital Skills framework measures inclusion across five key competencies:

  • Managing Information: Search engines, saving photos .
  • Communicating: Email, messaging, safe sharing .
  • Transacting: Buying items, installing apps .
  • Problem Solving: Verifying sources, online help .
  • Creating: Forms, digital media creation .

Causes and Affected Groups

The digital divide is driven by systemic geographical, psychological, economic, and physical hurdles affecting distinct population segments.

Primary Causes

  • Geography: Infrastructure costs and physical barriers (mountains, sparse populations) limit rural/LEDC connectivity .
  • Fear of IT: Lack of training or age-related anxiety makes sophisticated devices daunting .
  • Economics: High costs of innovations restrict advanced technology to higher-income brackets .
  • Disability: Inaccessible hardware or software interfaces isolate roughly 15% of the global population .

Key Affected Groups

  • Urban vs. Rural inhabitants
  • More vs. Less industrially developed nations
  • Technologically educated vs. uneducated individuals
  • Older generations vs. younger digital natives
  • High-income vs. low-income socio-economic groups
  • People living with physical, visual, or hearing disabilities

Statistical Trends & Visual Indicators

Surveys and empirical studies highlight the scale of the digital divide across national populations.

UK Non-User Trend (ONS Data)

According to ONS surveys, adult non-users in the UK dropped substantially over time . In 2018, approximately **5.3 million Britons (10% of adults)** had still not gone online in the prior three months, demonstrating slow uptake primarily concentrated among older and lower-income demographics .

2011
2013
2015
2017
2018

Fig: Relative drop in percentage of UK adults not using the internet (2011–2018) .

US Urban vs. Rural Adoption (Pew Research)

Data illustrates disparities in device ownership. While smartphone ownership has largely converged (~83% urban/suburban vs 71% rural), **home broadband** retains a noticeable gap, leaving rural populations disadvantaged for high-bandwidth professional and educational use .

  • Suburban Home Broadband: 79%
  • Urban Home Broadband: 75%
  • Rural Home Broadband: 63%

Broader Societal Impacts

Unequal access extends far beyond basic entertainment, directly altering life outcomes across major pillars of society.

Healthcare Access

Online appointment booking, digital prescriptions, telehealth, and bedside medical charts benefit affluent urban populations while isolated or low-income groups face barriers due to cost and poor connectivity .

Education & Literacy

Modern academic workflows demand web-based resource management, online assignment submissions, and digital literacy. Under-resourced schools and unequipped homes put students at a lasting competitive disadvantage .

Employment & Commerce

Job hunting relies on digital platforms, online CV submissions, and professional networking. Lacking broadband or digital skills forces individuals into lower-paying labor roles, widening economic stratification .

Public Services & Banking

The transition of government portals, tax services, online banking, and retail outlets online penalizes those without access or skills, frequently forcing expensive physical travel or inflated transaction costs .

Interactive Digital Divide Impact Simulator

Adjust the community parameters below to simulate how infrastructure investments, digital skills training, and subsidies alter overall digital inclusion and economic growth.


Simulation Results Dashboard

Digital Inclusion Rate 42%
Economic Competitiveness 50%
Vulnerable Isolation Risk High

Lesson Summary & Review Checklist

  • Definition: The digital divide reflects structural gaps in hardware, software, telecommunications access, and digital literacy .
  • Core Triggers: Driven by geography, economic inequality, IT anxiety, and physical disabilities .
  • Impacted Demographics: Rural communities, developing nations, older generations, lower-income households, and disabled individuals .
  • Mitigation Strategies: Requires multi-stakeholder collaboration (governments, private sector, NGOs) implementing fiber/satellite upgrades, community training programs, BPL (Broadband over Power Lines), and subsidized refurbished devices .

Summary Checklist

  • ✅ I can explain what is meant by the digital divide .
  • ✅ I can identify aspects affecting the divide such as age, socio-economic status, and geography .
  • ✅ I can discuss actionable measures taken to reduce the digital divide .

Chapter: Expert Systems & Artificial Intelligence

Explore the architecture, development workflow, reasoning mechanisms, and real-world applications of computerized decision-making systems.

What is an Expert System?

An expert system is a computerized system that attempts to reproduce the decision-making process of a human expert within a specific, well-defined field. Unlike standard software, expert systems use explicit reasoning models and knowledge bases to handle complex, open-ended scenarios.

Core Architectural Shell

Many system components are housed within a unified shell:

  • Inference Engine: The reasoning core that interrogates the rules and facts.
  • Explanation System: Explains the logical reasoning and justifies recommendations.
  • Knowledge Base Editor: Software enabling updates to rules and facts.
  • User Interface: Facilitates interaction between the user and the system.

Knowledge Base Breakdown

  • Database of Facts: Definitive factual knowledge and historical data collected from human specialists and background databases.
  • Rules Base: A collection of IF...THEN statements representing logical reasoning and heuristic experiences.

System Development: The Knowledge Engineer & Expert

When an expert system is created, a knowledge engineer is employed to work alongside human experts/specialists who possess deep subject knowledge:

  • Information Gathering: The engineer collects expert knowledge, reasoning strategies, and target system preferences. They also pull data from existing domain databases.
  • Design & Integration: The engineer and expert collaborate to define the core problem. The engineer then designs the knowledge base and rules base, integrating the information before creating the inference engine to power the reasoning aspect.

Deep Dive: The Inference Engine

The inference engine is the primary reasoning component. It operates via specific mechanisms:

  • Uses a series of IF...THEN statements within the rules base to interrogate the database of facts.
  • Takes user inputs, compares them against the database of facts, and processes rules to reach possible solutions.
  • Generates dynamic questions via the user interface based on received inputs to narrow down the number of possible solutions.
  • In short: It produces a set of possible solutions by comparing inputs with facts using the rules contained in the knowledge base.

The Explanation System & Editor

Explanation System

Explains the logical reasoning behind conclusions:

  • Shows how a particular conclusion was reached and why an alternative conclusion was not.
  • Explains why a specific fact was required or not required.
  • Justifies recommendations clearly to the user.

Knowledge Base Editor

A software utility enabling the knowledge engineer to modify, add, or refine rules and facts within the knowledge base to keep the system up to date.

System Components Diagram

SHELL
  • User Interface
  • Inference Engine (Reasoning Core)
  • Explanation System (Justifies Logic)
  • Knowledge Base Editor (Updates Rules)
KNOWLEDGE BASE
  • Database of Facts
  • Rules Base (IF...THEN statements)

Inference Engine & Chaining Strategies

The inference engine performs reasoning by interrogating the knowledge base using two primary chaining methods.

Backward Chaining (Goal-Driven)

Starts with a goal or hypothesis and works backward to see if available facts support it.

  • Best suited for: Classification systems, diagnostics, and problems with a limited set of definitive outcomes.
  • Behavior: Asks focused, logical questions mimicking a human consultant.

Forward Chaining (Data-Driven)

Starts with available input data and moves forward rule-by-rule to derive possible conclusions.

  • Best suited for: Open-ended problems, planning, design, and real-time control.
  • Behavior: Executes IF clauses matching current data to trigger THEN conclusions.

Classic Working Example: Edwina the Animal

Given Facts: Fact 1: Edwina has hooves. Fact 2: Edwina can run fast.

Rules Base:
Rule 1: IF X has hooves AND can run fast, THEN X is a zebra.
Rule 3: IF X is a zebra, THEN X has a striped coat.

Backward Approach: Starts at goal ("Does Edwina have stripes?"), works back to Rule 3, then Rule 1, verifying facts.
Forward Approach: Starts with Facts 1 & 2, matches Rule 1 ("Edwina is a zebra"), then advances to Rule 3 ("Edwina has a striped coat").

Applications Across Industries

Expert systems are versatile tools deployed across diverse professional and technical domains.

Medical Diagnosis

Systems prompt users for symptoms, matching them against medical databases to output ranked probabilities, assisting practitioners or guiding patient triage.

Car Engine Fault Diagnosis

Mechanics plug diagnostic units into engine management systems or input dashboard error codes to receive ordered lists of potential faults and sensor readings.

Financial Planning & Investment

Assists advisors by analyzing client investment capital, risk appetite, and return targets against historical market stability to recommend optimal asset allocations.

Route Scheduling & Logistics

Solves complex routing problems by calculating multi-vehicle delivery schedules that minimize mileage, fuel costs, and transit times.

Interactive Expert System Inference Simulator

Test how an inference engine processes inputs through a rule base. Select symptoms or criteria below to simulate diagnostic evaluation.


Inference Output Log:

Click "Run Inference Engine" to evaluate rules...

Advantages, Limitations & Lesson Summary

Advantages

  • Consistent logical conclusions without emotional bias.
  • Available 24/7 without fatigue.
  • Preserves rare expertise of departing specialists.
  • Can process vast multidimensional data faster than humans.

Limitations

  • Lack of human intuition and common sense.
  • Garbage in, garbage out: dependent on accurate rules.
  • High development costs and complexity.
  • Rigid environment adaptation requires manual rule editing.

Comprehensive Lesson Summary Checklist

  • ✅ Defined expert systems, shell components, knowledge engineers, and human experts.
  • ✅ Detailed the inner workings of the inference engine, question generation, and rule evaluation.
  • ✅ Covered explanation systems (justifying choices and why alternatives weren't chosen) and knowledge base editors.
  • ✅ Contrasted backward chaining with forward chaining and examined real-world deployment.

8.1 Create Spreadsheet

Spreadsheet Basics

A spreadsheet is a two-dimensional table split into rows and columns, containing individual cells with unique addresses.
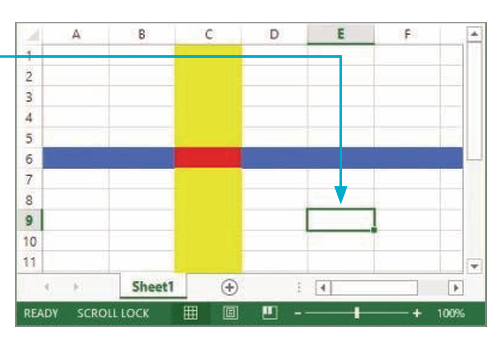
Spreadsheet grid structure

Figure 1: Spreadsheet grid structure with rows, columns, and cell references.

  • Cell Contents: Each cell can hold a number, text (including hyperlinks called a label), or a formula starting with an equals sign ($=$).

Importing Data into Excel

Comma-separated values (.csv) files are frequently used as source files. To open them:

  • Click on the drop-down menu for file types and select Text Files to view .csv or .txt files.
  • Double-click on the target file (e.g., Staff.csv) to open it.

8.1.1 Create the Structure

Page Specifications & Margins

To configure page properties, select the Page Layout tab.

  • Orientation: Switch between Portrait and Landscape using the Orientation drop-down.
  • Margins: Select Normal, Wide, Narrow, or choose Custom Margins to open the Page Setup window.

8.1.2 Formulas, Functions & Advanced Operations

Calculations automate data processing using mathematical operators, cell referencing, named ranges, and built-in function libraries. Formulas are always preceded by an equals sign ($=$).

Core Mathematical & Statistical Functions

  • Aggregation & Basic Stats: Use SUM, AVERAGE, MAX, MIN, MEDIAN, and MODE to process numerical ranges.
  • Counting & Conditional: Use COUNT, COUNTA, COUNTIF, and SUMIF for conditional processing.

8.1.3 Validation Rules

Data entry errors can be minimized by implementing validation rules on cells:

  • Whole Numbers: Restrict entries to whole numbers within a specific range with custom error alerts and input messages.
  • List Drop-downs: Restrict entries to predefined lists (e.g., cell ranges) to reduce typographical errors.

8.1.4 Formatting

Cell Formatting Basics

The format in which Excel stores data is often different from the format used to display that data. Quick formatting can be applied via the Home tab's Number group, while detailed adjustments are made through the Format Cells dialog box.

8.2 Test a spreadsheet

Overview of Spreadsheet Testing

Designing a test plan and choosing your test data are the most important parts of testing any spreadsheet. All formulae and validation rules must be tested to ensure they function as expected.

Table 8.12: Completed test plan for Task_8at: cell B6 - Version 1
Test type Formula Cell B2 B3 B4 Expected result Actual result Remedial action
FormulaCellB611165Yes - change formula?
FormulaCellB62222420Yes - change formula?
FormulaCellB62233228Yes - change formula?
FormulaCellB61052160110Yes - change formula?
FormulaCellB6101.527661Yes - change formula?
Table 8.13: Completed test plan for Task_8at: cell B6 - Version 2
Test type Formula Cell B2 B3 B4 Expected result Actual result Remedial action
FormulaCellB611166No
FormulaCellB62222424No
FormulaCellB62233232No
FormulaCellB61052160160No
FormulaCellB6101.527676No

8.3 Use a spreadsheet

This section includes searching for data extracts, sorting data, summarising data, and exporting data[cite: 10].

8.3.1 Extract data

Search using text filters: Getting Excel to search through data held in a spreadsheet to extract only rows where the data matches your search criteria[cite: 10].

Search using numeric data

Examine Table 8.14 carefully to relate how comparison operators can be interchanged with text in AutoFilter searches[cite: 10].

Table 8.14: Comparison operators and their equivalent text[cite: 10]
Operator Text Example Description
=Equal to / Like$X=Y$X is equal to Y
<>Not equal to$X<>Y$X is not equal to Y
>Greater than$X>Y$X is greater than Y
<Less than$X<Y$X is less than Y
>=Greater than or equal to$X>=Y$X is greater than or equal to Y
<=Less than or equal to$X<=Y$X is less than or equal to Y

Sort data

Before you sort data, make sure that you select all the data for each item to be sorted. A common error is to select and sort on a single column and therefore lose data integrity[cite: 10].

Table 8.15: Sorting data with correct and incorrect data selected[cite: 10]
Original data Sorted correctly with all data selected Sorted with only the name column selected
Name | Maths | English
Karla | 72 | 75
Marcos | 64 | 34
Sheila | 61 | 44
Vikram | 52 | 75
Name | Maths | English
Sheila | 72 | 75
Marcos | 64 | 34
Vikram | 61 | 44
Karla | 52 | 75
Name | Maths | English
Karla | 52 | 75
Marcos | 64 | 34
Sheila | 72 | 75
Vikram | 61 | 44

Pivot tables & Pivot charts

A pivot table can analyse and summarise data into a two-dimensional table to see patterns and trends in data[cite: 10]. Pivot charts provide graphical representations of summarized pivot table data[cite: 10].

Interactive Formula & Function Calculator

Test how spreadsheet formulas process inputs dynamically in real-time.

Sum ($=B2+B3$): 6

Product ($=B2*B3$): 8

Power ($=B2\text{\textasciicircum}B3$): 16